Sample data
FED DEC CUT68¢▲ 27SHUTDOWN31¢▲ 12BTC >150K22¢▼ 9SPX >700054¢▼ 6KC TITLE14¢▲ 3RECESSION18¢▼ 2AI MODEL73¢▲ 5CPI <3%47¢▲ 8FED DEC CUT68¢▲ 27SHUTDOWN31¢▲ 12BTC >150K22¢▼ 9SPX >700054¢▼ 6KC TITLE14¢▲ 3RECESSION18¢▼ 2AI MODEL73¢▲ 5CPI <3%47¢▲ 8
PredictionStars Get the daily brief
Prediction markets, explained

The odds moved.
Here’s why.

PredictionStars tracks the biggest swings across prediction markets and explains the news behind them in a few minutes of reading. No hype, no trading tips. Just what the crowd with money on the line expects, and what changed its mind.
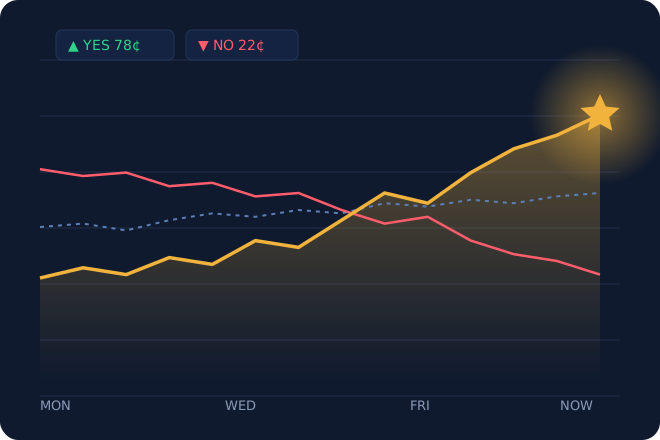
Illustration of market price lines rising toward a star
Launch preview. We’re in our launch period. Market prices on this page are sample data showing how coverage will look, not live quotes.

Biggest movers · 24h

Sample data
  1. 1
    Fed cuts rates at the December meeting?Economy
    68%▲ 27
  2. 2
    Federal government shutdown before Dec 31?Politics
    31%▲ 12
  3. 3
    Bitcoin above $150K on Dec 31?Crypto
    22%▼ 9
  4. 4
    CPI year-over-year below 3% next print?Economy
    47%▲ 8
  5. 5
    S&P 500 closes the year above 7,000?Markets
    54%▼ 6
  6. 6
    New frontier AI model released this quarter?Tech
    73%▲ 5

What counts as a mover?

We rank markets above our volume floor by how far the Yes price moved in the last 24 hours. Big moves in thin markets don’t make the board.

Read the methodology

Latest

Markets we’re watching

Sample data
EconomySample

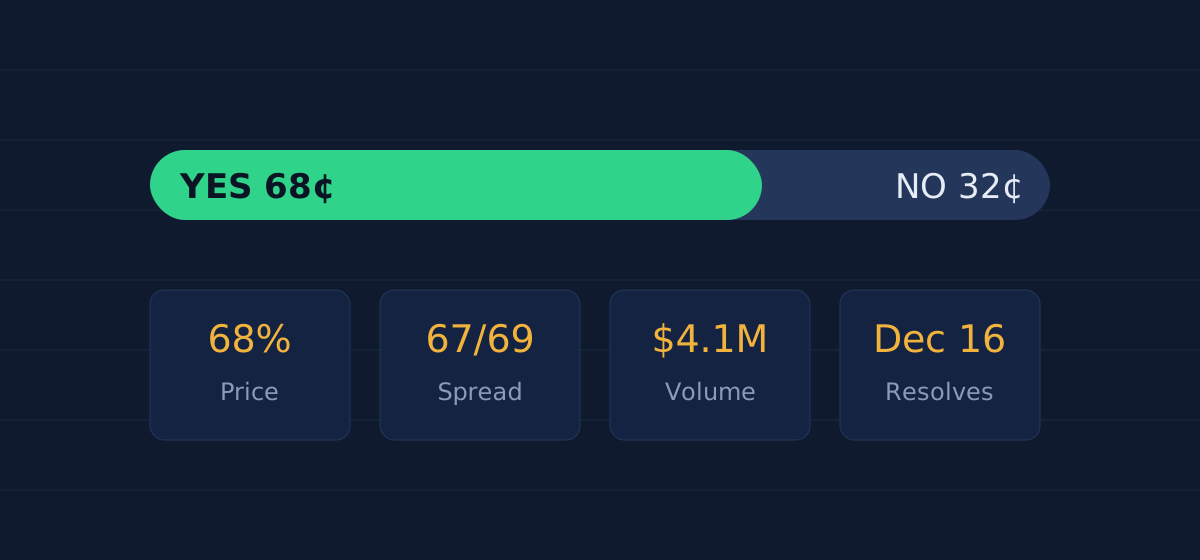
Fed cuts rates at the December meeting?

68%▲ 2724h
Yes 68¢No 32¢Vol $4.1M
PoliticsSample

Federal government shutdown before Dec 31?

31%▲ 1224h
Yes 31¢No 69¢Vol $2.6M
CryptoSample

Bitcoin above $150K on Dec 31?

22%▼ 924h
Yes 22¢No 78¢Vol $3.3M
MarketsSample

S&P 500 closes the year above 7,000?

54%▼ 624h
Yes 54¢No 46¢Vol $1.9M
SportsSample

Chiefs win the next Super Bowl?

14%▲ 324h
Yes 14¢No 86¢Vol $5.2M
EconomySample

US recession declared in 2026?

18%▼ 224h
Yes 18¢No 82¢Vol $0.9M

Coverage

Accountability

The scorecard

Forecasts are only useful if someone checks them. Once live coverage starts, we’ll log every market we write about and compare its price with how it actually resolved, right here, wins and misses alike.
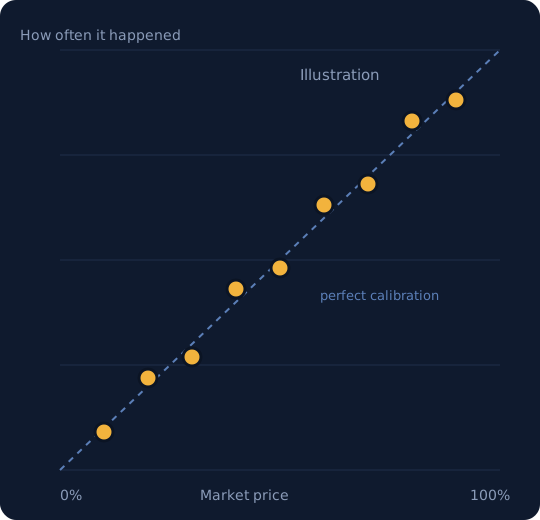
Chart comparing forecast probability with how often events happened

The daily brief

The three biggest market moves of the day and why they happened, in your inbox each morning. Sign-ups open at launch.