How to read a prediction market in ten seconds
Price, spread, volume and the fine print. Four numbers tell you almost everything about a market.
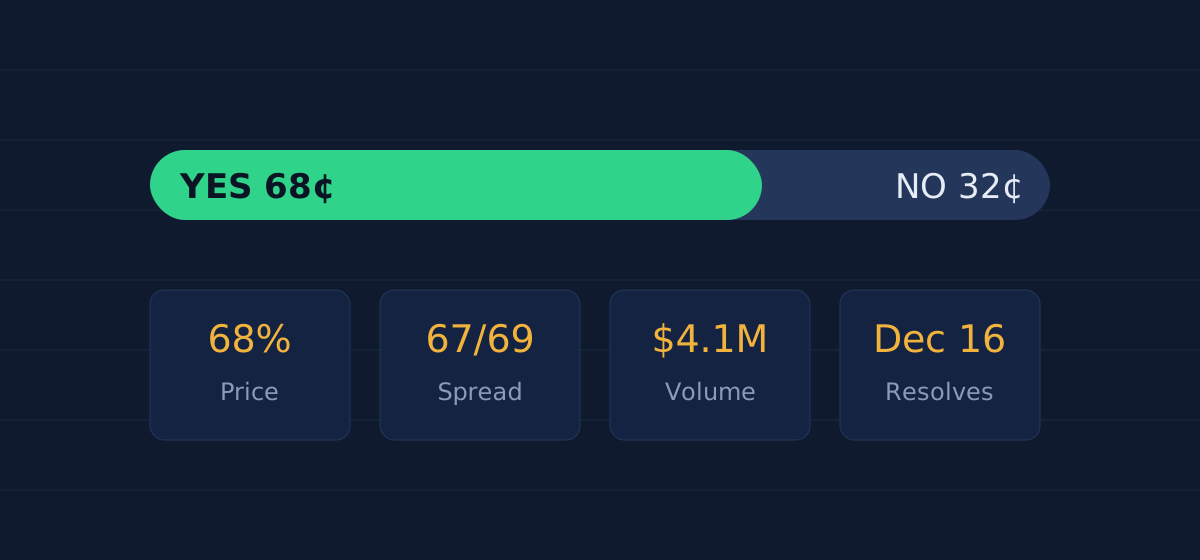
Market pages can look busy, but you only need four things to understand one. Here’s the quick version, using a sample market: “Will the Fed cut rates at its December meeting?” trading at 68 cents.
1. The price is the probability
68 cents means the market puts the chance at about 68%. The “No” side trades at roughly the other 32 cents. If you’re used to sportsbook odds, 68% works out to about −213 in American odds, and 25% is +300. The conversion is easy: for anything above 50%, divide the probability by the remainder and multiply by −100; below 50%, divide the remainder by the probability and multiply by +100.
2. The spread shows how firm the price is
Markets show a bid (what buyers will pay) and an ask (what sellers want). A 67/69 spread means the price is well defined. A 55/75 spread means nobody really agrees, and the “price” is closer to a guess.
3. Volume tells you how much to trust it
Volume is how much money has traded. More money means more people have weighed in and it costs more to move the price. On PredictionStars, every market card shows volume next to the price so you can judge for yourself.
4. The rules decide who gets paid
Every market has resolution rules: the exact wording, the source used to settle it and the deadline. Disputes almost always come down to these details. We link to the rules on every market we cover.
Bonus: the 24-hour move
The change over the last day is what turns a number into a story. A market sitting at 68% for a month isn’t news. A market that jumped from 41% to 68% after a data release is. That jump is what our Biggest movers board tracks.